 |
|
|
|
Graphing Linear EquationsA very important topic in algebra is graphing linear equations. GradeA will show you how to graph using slope-intercept form and also the two intercepts method.
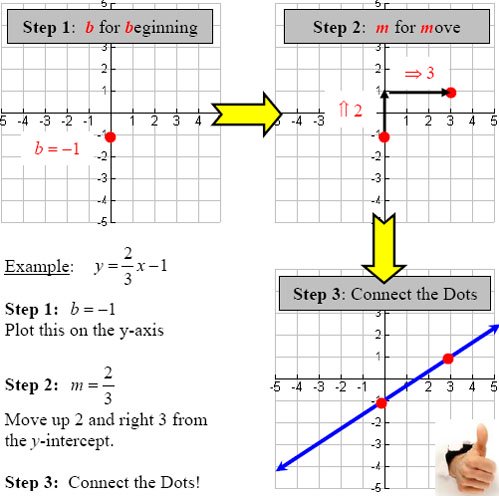
m represents the slope of the line. More: Understand slope & Calculate slope. b represents the y-intercept of the line. More about the y-intercept
First, identify in this equation that m = 2/3 and b = -1. Now, simply follow the 3 easy steps below to complete the graph.
Graphing linear equations is really that simple. First plot the beginning, then make the move, and finally connect the dots. The reason we have equations of lines is so that we can determine two things: the steepness and direction.
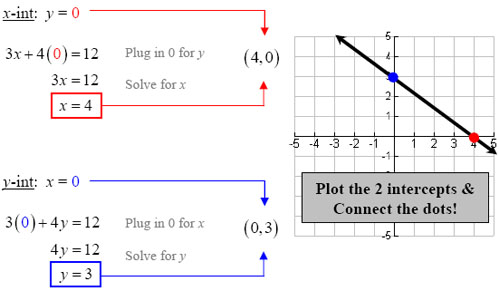
The intercepts are the points on the line that cross the axes. If we find both the x-intercept and the y-intercept, we can draw our line through those two points. The important thing to remember about intercepts is that they work in reverse of each other. To find the x-intercept, use y = 0, and then to find the y-intercept, use x = 0. If you always remember to write that trick at the top of the problem, you won't make any mistakes.
That is, write...
There's alot more to linear equations than just graphing. Return from Graphing Linear Equations to Free Algebra Help. Or visit the GradeA homepage for more free math help resources.
|
||||||||||||||||||||
| . | ||
| Home │ Site Search │ Math Help Blog │ Help Keep GradeA Free | |
Written by Team GradeAmathhelp.com, all rights reserved. | ||

